
Why Pool Service Rates Vary So Much By State: Data From 52 Pros

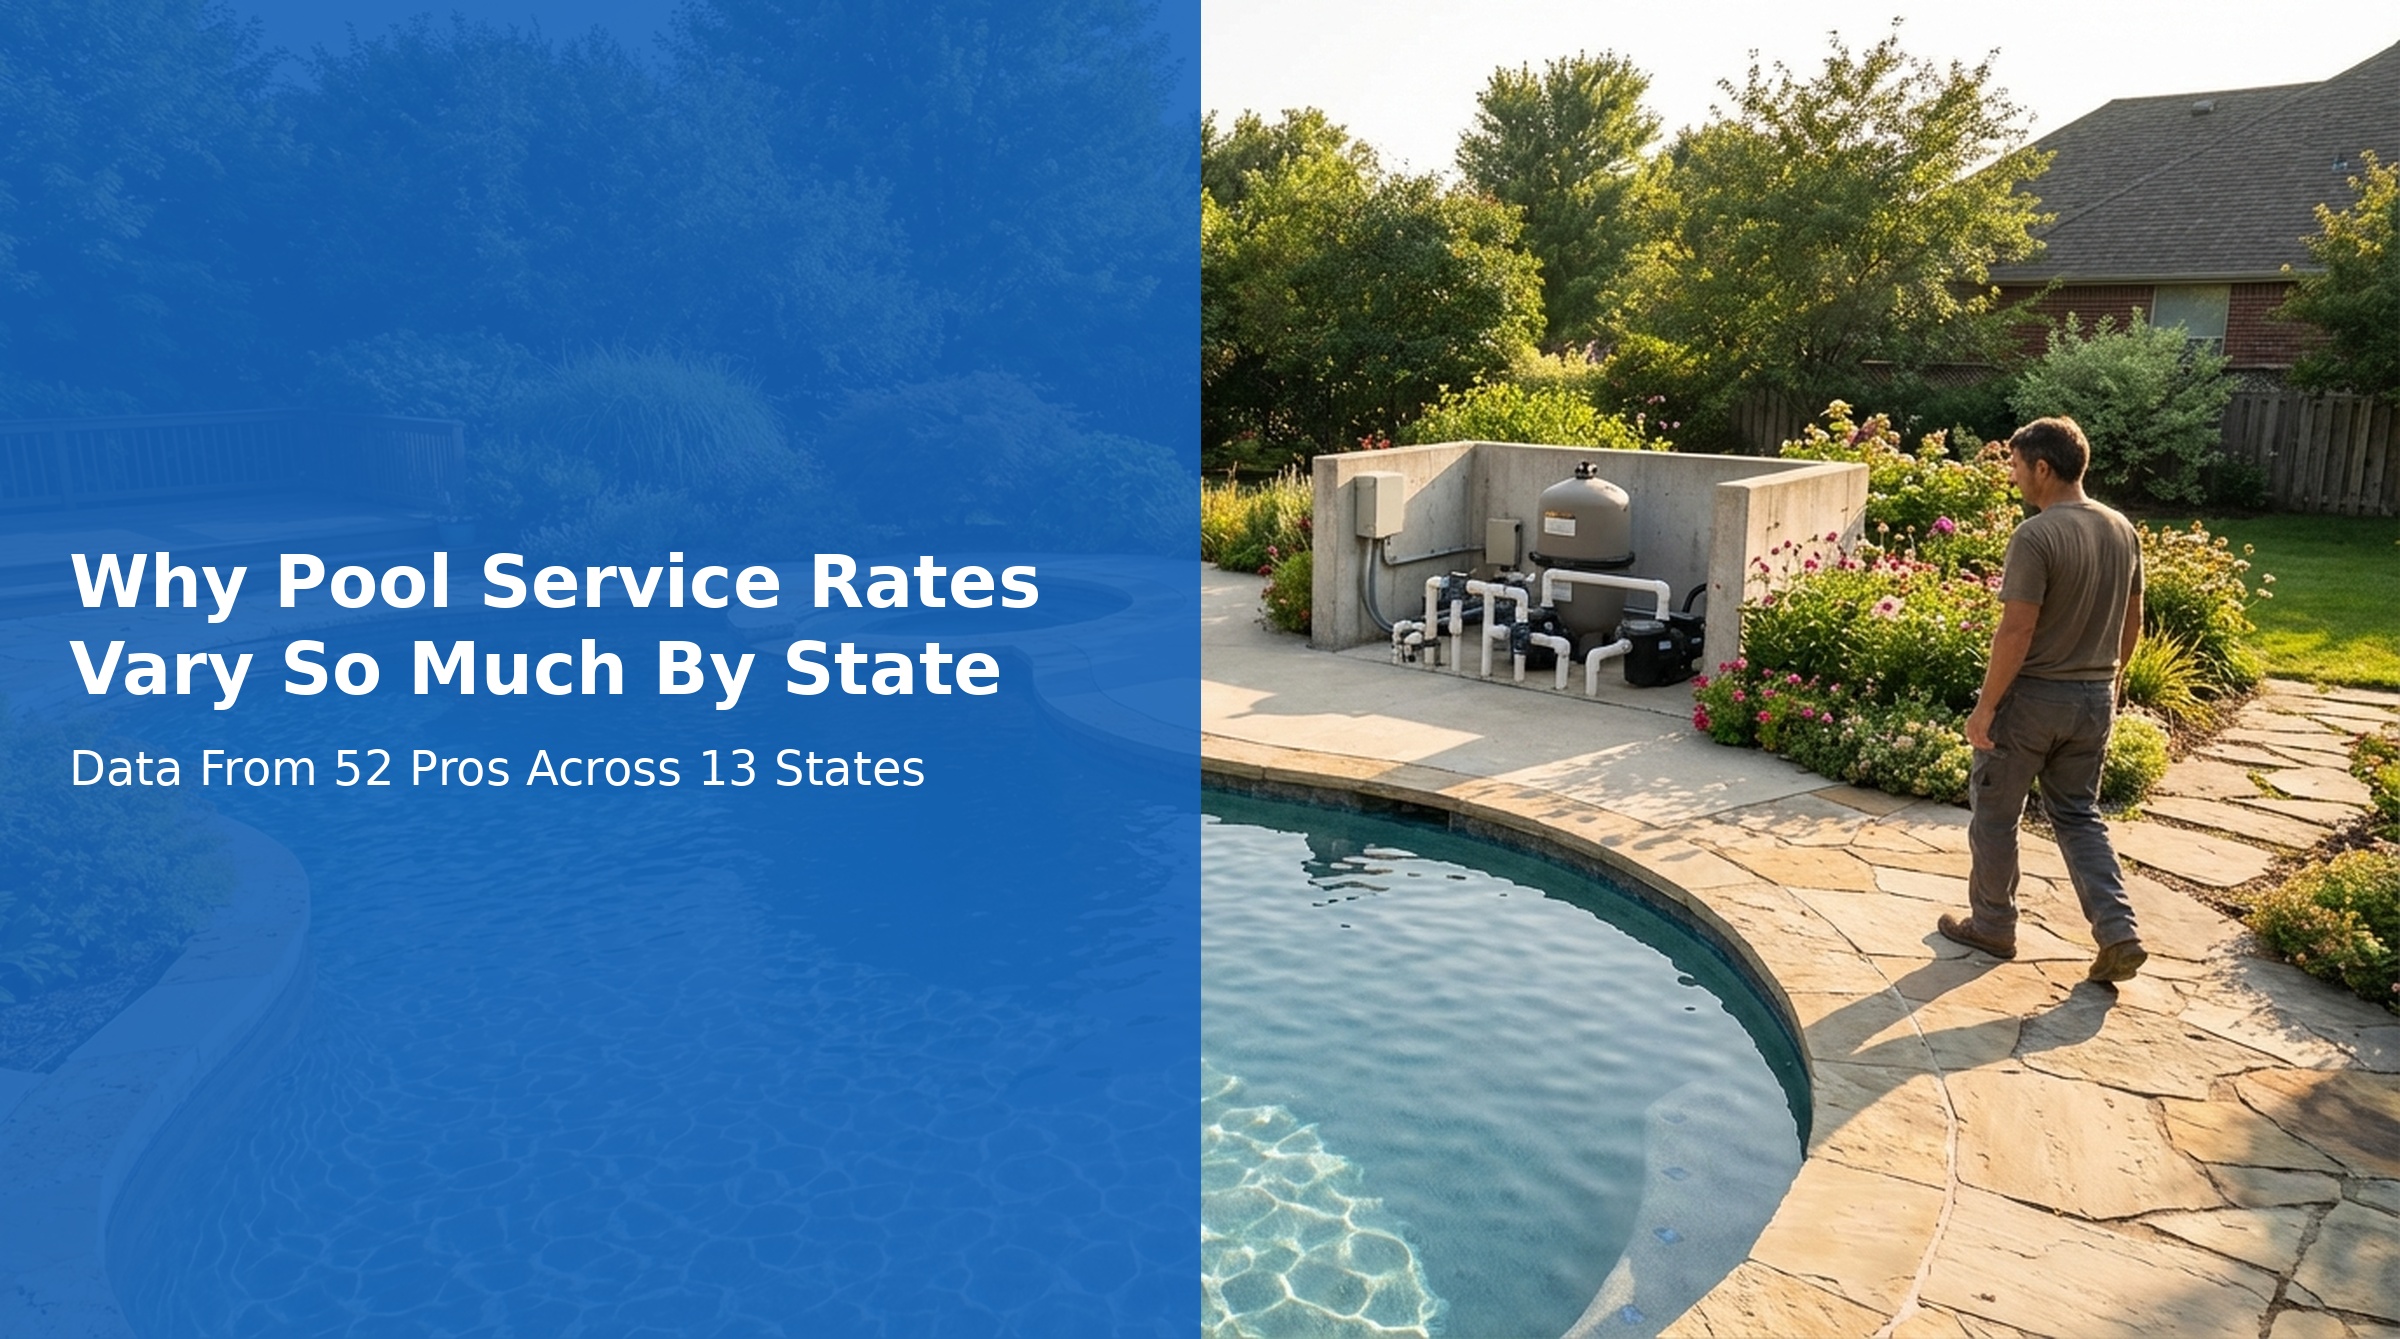
A pool pro in Arizona charges $150 a month. A pool pro in Maryland charges $600 a month. Same job title, same chlorine, same skimmer basket. So what gives?
We asked 52 pool service professionals across 13 states to share their rates on poolrates.fyi. Then we ran a correlation analysis on the numbers. The answer surprised us: it's not about income. It's about how many months you work.
Key Findings
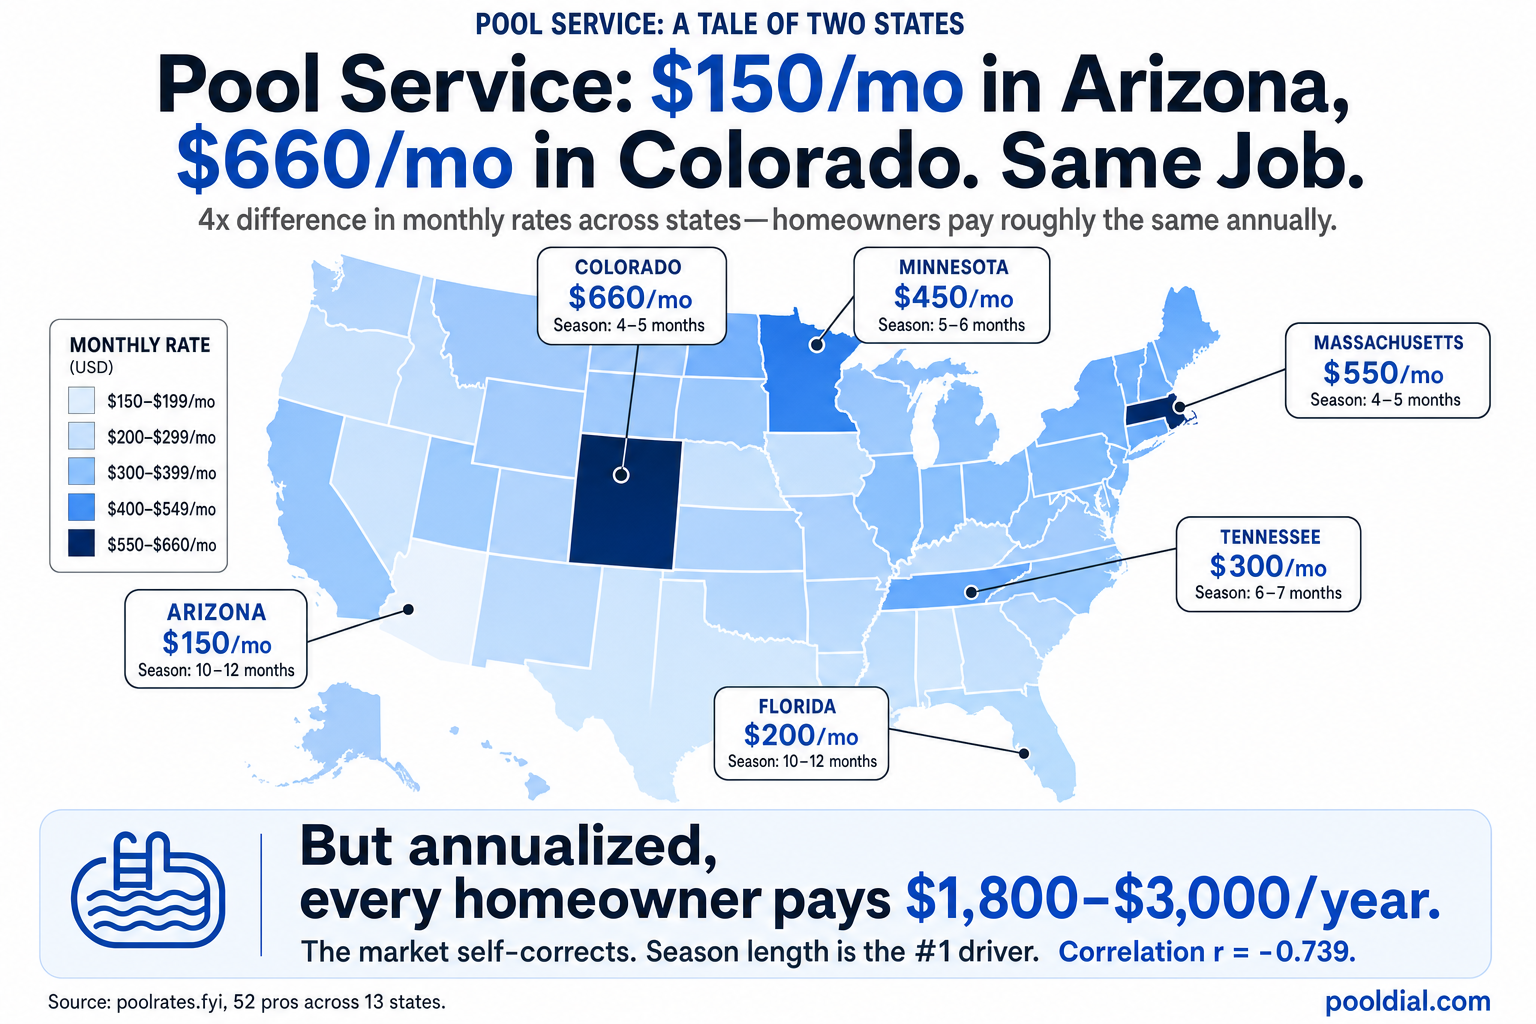
- Season length is the #1 factor — States with shorter pool seasons charge significantly more per month (r = -0.739)
- Income matters, but less than you'd think — Higher-income areas correlate with higher rates, but it's only moderate (r = 0.622)
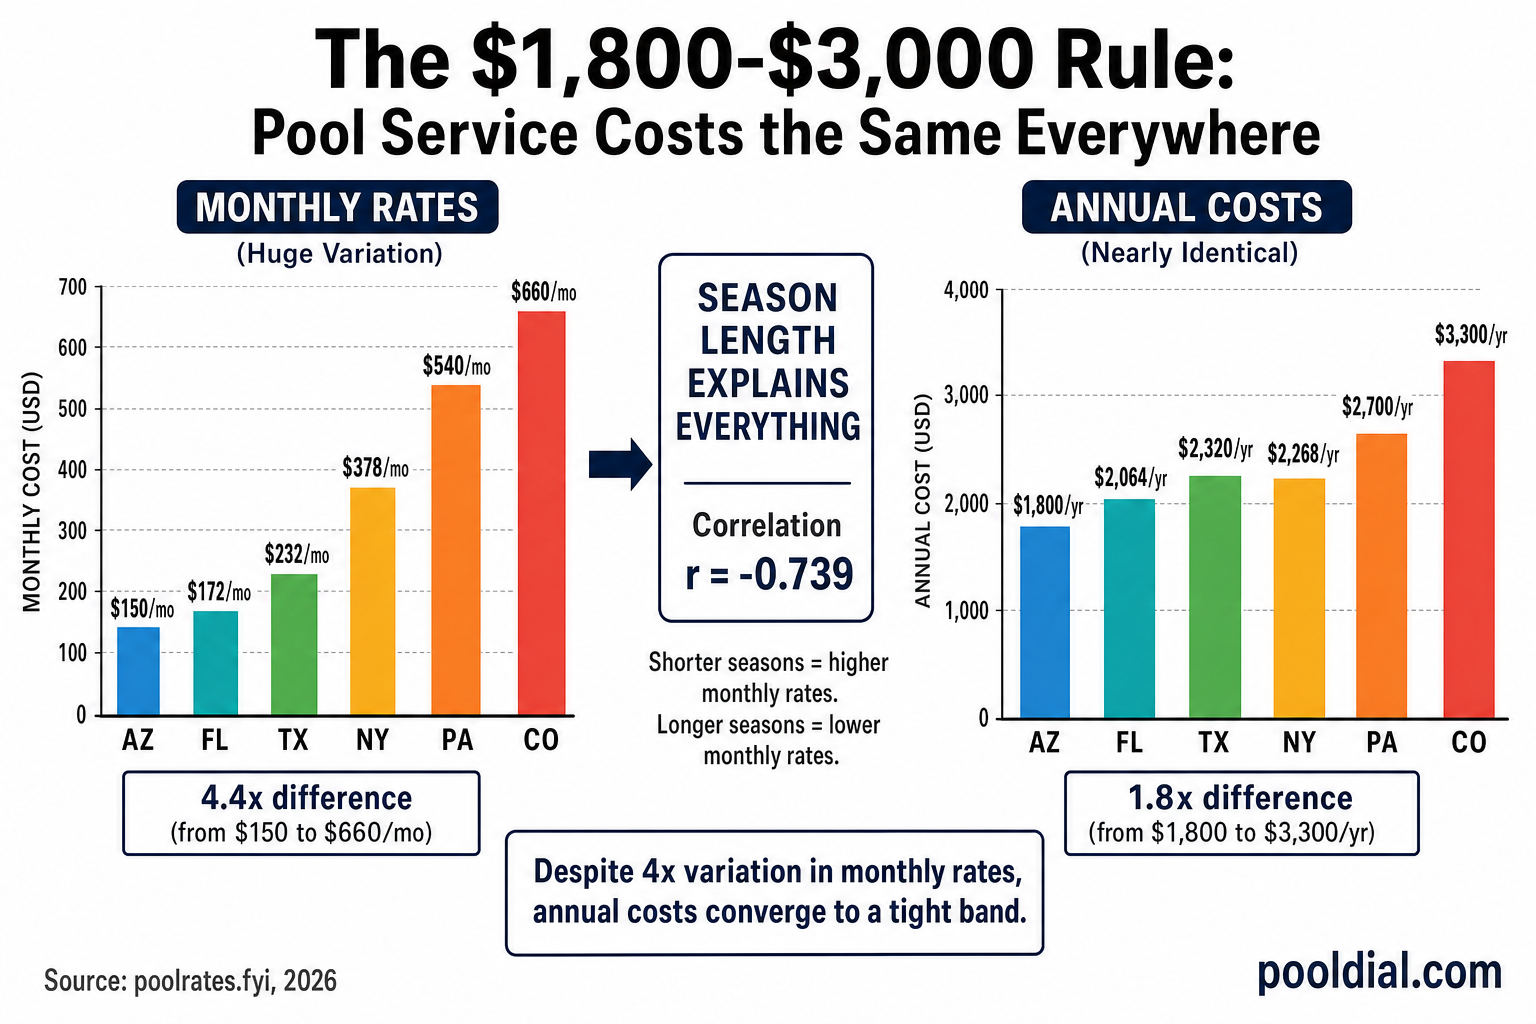
- Annual costs normalize everywhere — When you multiply monthly rate by season length, homeowners pay $1,800–$3,000/year regardless of state
- National average is $249/mo — but the median is only $200/mo, with a range from $100 to $880
The Raw Numbers: What 52 Pros Actually Charge
We collected rate data from pool professionals across Arizona, Florida, California, Texas, Alabama, Georgia, North Carolina, New York, Virginia, New Jersey, Pennsylvania, Maryland, and Colorado. Here's what the data looks like.
Source: poolrates.fyi crowdsourced data, March 2026
State-by-State Averages
The gap between states is dramatic. Arizona pros charge less than a third of what Maryland pros charge per month.
| State | Avg Monthly Rate | Season (Months) | Est. Annual Cost |
|---|---|---|---|
| Arizona | $150/mo | 12 | $1,800 |
| Florida | $172/mo | 12 | $2,064 |
| California | $175/mo | 11 | $1,925 |
| Alabama | $230/mo | 9 | $2,070 |
| Texas | $232/mo | 10 | $2,320 |
| Georgia | $277/mo | 8 | $2,216 |
| North Carolina | $350/mo | 7 | $2,450 |
| New York | $378/mo | 6 | $2,268 |
| Virginia | $450/mo | 6 | $2,700 |
| New Jersey | $530/mo | 4 | $2,120 |
| Pennsylvania | $540/mo | 5 | $2,700 |
| Maryland | $600/mo | 5 | $3,000 |
| Colorado | $660/mo | 5 | $3,300 |
Look at the last column. Despite a 4x difference in monthly rates between Arizona and Colorado, the estimated annual cost to the homeowner only varies from $1,800 to $3,300. The market self-corrects.
Seasonality Is the #1 Driver (Not Income)
We ran a Pearson correlation analysis across 15 states to test what actually drives rate differences. We compared monthly rates against two variables: season length (months of service per year) and per capita income.
| Comparison | Correlation (r) | Strength |
|---|---|---|
| Monthly Rate vs. Season Length | r = -0.739 | Strong negative |
| Monthly Rate vs. Income Per Capita | r = 0.622 | Moderate positive |
| Annual Cost vs. Income Per Capita | r = 0.109 | No correlation |
The strongest signal is season length. The shorter the season, the higher the monthly rate. This makes intuitive sense: a pro in New Jersey has 16 weeks of weekly service to earn what an Arizona pro earns in 52 weeks. The monthly rate has to be higher, or the business doesn't survive.
Income plays a role (r = 0.622), but it's secondary. And here's what's fascinating: when you annualize the cost (monthly rate multiplied by months of service), the correlation with income drops to basically zero (r = 0.109). Homeowners everywhere pay roughly the same amount per year for pool service. The market just distributes it differently based on how many months you work.
Rate as a Percentage of Monthly Income
To put this in perspective, here's what pool service costs as a share of monthly per capita income by state:
- Arizona: 4.2% of monthly income
- Florida: 4.6%
- Texas: 5.2%
- California: 5.5%
- Georgia: 7.3%
- Colorado: 15.0%
In Sunbelt states, pool service is a relatively small expense. In seasonal states, it takes a bigger bite of household income — but only during the months when service is active. Annualized, the financial burden is comparable.
What Pros on the Ground Say
The numbers tell one story, but the pros who live these rates every day add context that data alone can't capture.
This NJ pro's breakdown reveals a critical truth: overhead doesn't scale down with season length. Insurance is annual. Truck payments are monthly. If you're only billing for 16 weeks, each visit has to carry more of the fixed-cost burden.
Environmental factors matter too. A pool in Scottsdale surrounded by desert landscaping takes less time to service than a pool in Atlanta shaded by oaks. More debris means more time per stop, which justifies higher per-pool rates.
Three Types of Pool Service Markets
One experienced professional broke down the U.S. pool service market into three distinct types, each with fundamentally different economics.
Type 1: Dense Markets
- 20+ pools per day
- ~20 minutes per pool
- Minimal driving between stops
- Primarily chemicals and cleaning
- Year-round service
Type 2: Moderate Markets
- 10–15 pools per day
- 30–40 minutes per pool
- More driving between stops
- Broader repair skills needed
- 8–10 month season
Type 3: Sparse Markets
- 6–10 pools per day
- Mix of 20–60 minute visits
- Significant drive time
- Diagnostics and repair focus
- 4–6 month season
In Type 1 markets (Arizona, Florida, parts of California), pool density allows for efficient routing. Pros can service 20+ pools per day because they're close together and the scope of each visit is primarily chemical balancing and quick cleaning. Competition is high, which keeps prices in check.
In Type 3 markets (New Jersey, Pennsylvania, Colorado), pools are more spread out, and the pros who service them tend to offer a broader skill set. Weekly service often includes vacuuming, brushing, baskets, full filter work, and diagnosis of equipment issues. Some pros in these markets include minor repairs in their weekly rate, making the monthly number less directly comparable to a Type 1 market.
Service Type and Business Structure Also Matter
Beyond geography, two other factors shape what pros charge: what's included in the service, and how the business is structured.
By Service Type
| Service Type | Average Monthly Rate |
|---|---|
| Chemical-only | $150/mo |
| Full service with chemicals | $231/mo |
| Full service without chemicals | $351/mo |
The "without chemicals" rate being higher than "with chemicals" may seem counterintuitive, but it reflects a market dynamic: pros who bill chemicals separately tend to operate in higher-cost seasonal markets where the base service rate is already elevated. The service price calculator can help you model different bundling strategies for your market.
Solo Operators vs. Teams
| Business Type | Average Monthly Rate |
|---|---|
| Solo operator | $210/mo |
| Team operation | $296/mo |
Team operations charge about 40% more on average. This likely reflects two things: teams tend to operate in higher-cost markets, and running a team comes with overhead (payroll, vehicles, insurance for employees) that solo operators don't have. For more on the economics of scaling, see our guide on pool service business growth stages.
Biggest Operations in the Survey
Some of the largest operations in our dataset reveal what high-volume looks like across different markets:
- 1,600 pools in Lake Havasu, AZ at $150/mo — 4 years in business
- 1,500 pools in SoCal at $300/mo — 28 years in business
- 1,100 pools in Bay Area, CA at $220/mo — 16 people, 11 years
- 650 pools in Phoenix, AZ at $150/mo — 15 people, 22 years
- 300 pools in Philadelphia, PA at $200/mo — 16 people, 20 years
- 145 pools in Dallas-Fort Worth, TX at $400/mo — 30 years in business
The pattern holds: high-density Sunbelt markets support massive pool counts at lower per-pool rates, while seasonal and less dense markets sustain fewer pools at higher rates. Both models can produce strong revenue. Use the cost per pool calculator to see how your numbers compare.
California Metro Breakdown
California is large enough to show meaningful intra-state variation:
| Metro Area | Average Monthly Rate |
|---|---|
| Central Valley | $135/mo |
| Inland Empire | $170/mo |
| Los Angeles | $178/mo |
| San Diego | $165/mo |
| Bay Area | $220/mo |
The Bay Area commands a premium that tracks with its higher cost of living and per capita income. But even within California, the Central Valley-to-Bay Area spread ($135 vs. $220) is modest compared to the Arizona-to-Maryland spread nationally. For a deeper look at California pricing, see our California pool service rates guide.
What This Means If You're Setting Prices
The data suggests a few practical takeaways for pool service professionals:
- Don't compare your rate to a different climate. A $150/mo rate in Phoenix and a $600/mo rate in Maryland can both be perfectly appropriate. The homeowner is paying roughly the same amount per year.
- Factor in your true season length. If you work 6 months, your monthly rate needs to be roughly 2x what a year-round pro charges to generate the same annual revenue. Use the price increase calculator to model the impact.
- Scope of service matters. If your weekly visit includes vacuuming, brushing, filter cleaning, and equipment checks, your rate should reflect that. Don't compare yourself to a chems-and-skim operator.
- Team overhead is real. If you're a solo operator comparing yourself to team operations, remember that teams carry 30-50% more overhead. Their higher rate doesn't mean higher margins.
If looking at this data made you realize you're undercharging, we built a price increase letter generator to help you communicate the change to customers.
See the full data for your state
Browse crowdsourced rates from pool pros across all 50 states, broken down by metro area, service type, and business size.
View Rates on poolrates.fyiMethodology
Rate data was collected via poolrates.fyi, a crowdsourced pricing database for pool service professionals. Data includes self-reported monthly rates, service types, pool counts, and business details from 52 professionals across 13 states. Correlation analysis used Pearson's r coefficient comparing monthly rates against BEA per capita income data and estimated season lengths by state. Season lengths were estimated based on typical service months reported by pros in each state.
This is an evolving dataset. If you're a pool service professional, you can submit your rate to help build a more complete picture of the industry.